Dashboard
The Dashboard is the overview screen you land on after signing in to the
Athena console (/dashboard). It gives an at-a-glance view of your fleet — how many
agents are online, what is deploying right now, and which commands are queued — and it keeps
those numbers current in real time. Every panel links out to the full page behind it, so the
Dashboard doubles as your starting point for daily operations.
The Dashboard requires an authenticated session. Opening the site root
(/) redirects to the sign-in page; after you sign in you are taken to
/dashboard. See Authentication & SSO.
Status cards#
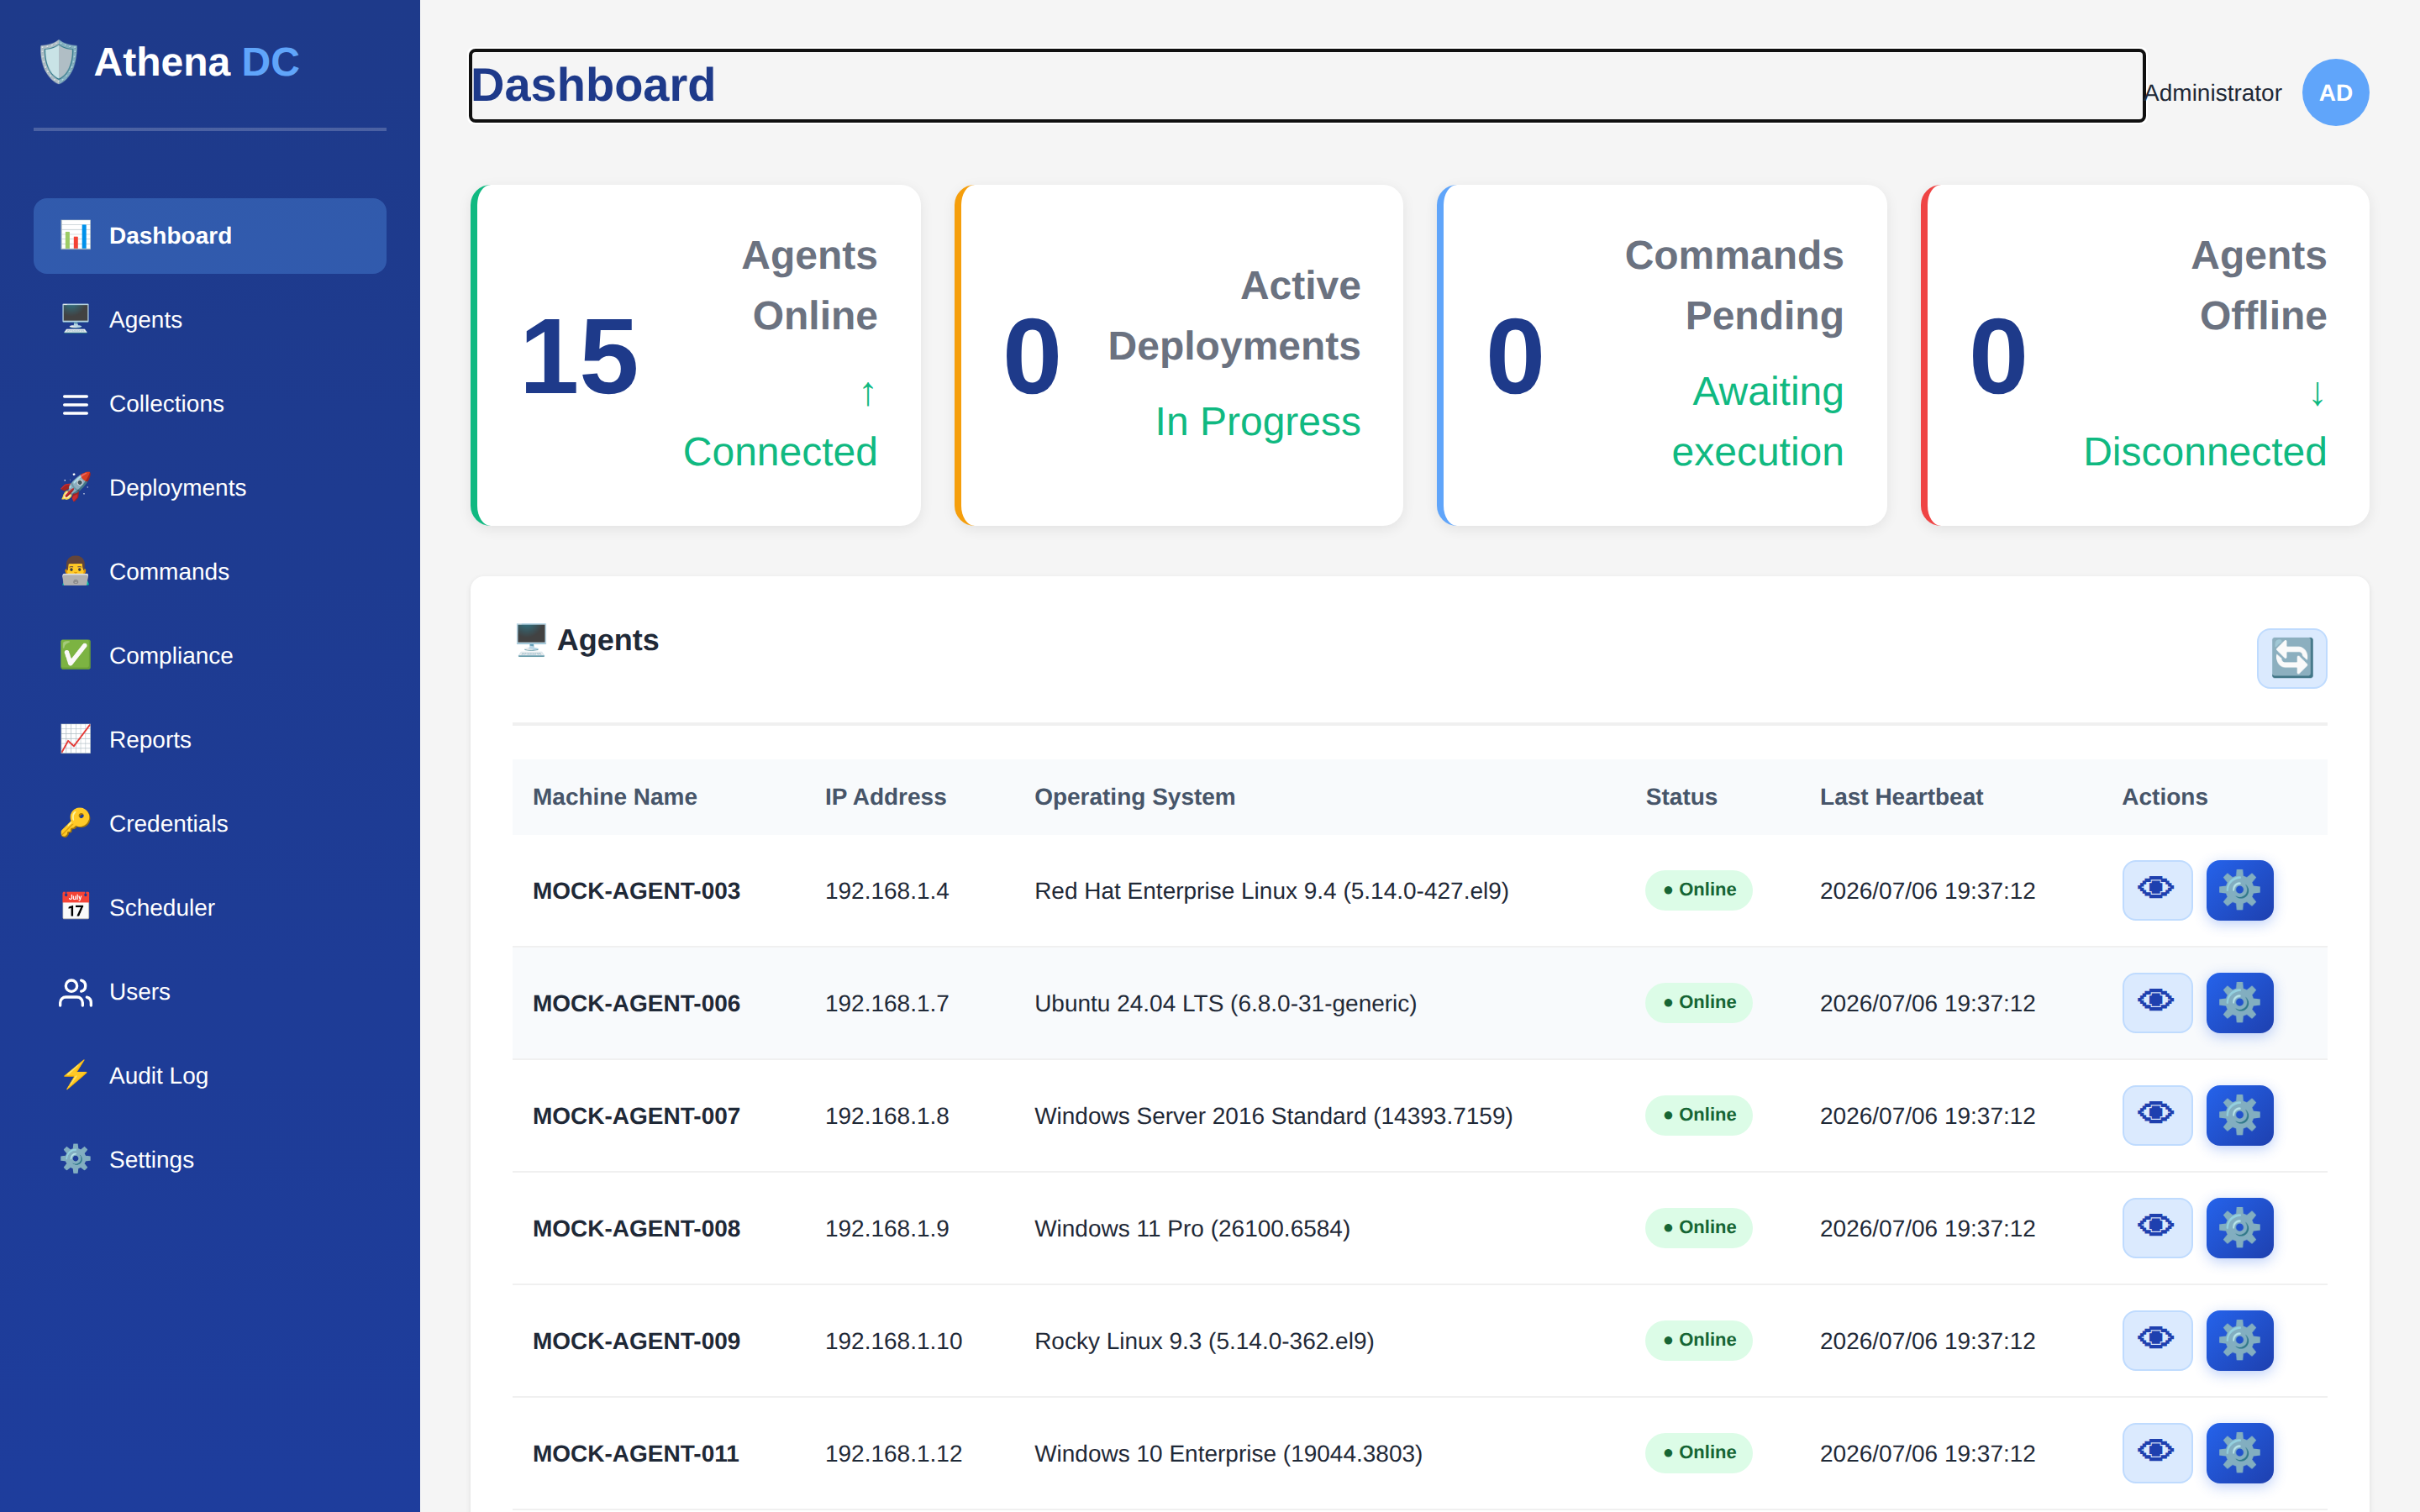
Four summary cards run across the top of the Dashboard. Each shows a single live count that reflects your entire fleet, not just the agents currently shown in the table below.
| Card | What it counts |
|---|---|
| Agents Online | Agents whose status is Online and whose last heartbeat is recent (see how online is decided). |
| Active Deployments | Deployment executions that are Running or Pending — everything currently in flight. |
| Commands Pending | Remote commands that are Pending or Running — queued or executing right now. |
| Agents Offline | Every other registered agent — those with a stale heartbeat or an offline/revoked status. |
Together the Online and Offline cards always add up to the total number of registered agents, so the pair gives you an instant read on fleet reachability.
How agent health is decided#
An agent counts as online when both of these are true: its stored status is
Online, and its most recent heartbeat arrived within the heartbeat-timeout
window. That window is controlled by the Agent:HeartbeatTimeoutSeconds setting and
defaults to 60 seconds. Any agent that fails either test — a stale heartbeat,
or a status of offline or revoked — is counted as offline.
The online count is also cross-checked against live agent connections to the server: if more agents are actively connected than the database has yet recorded as online (for example during a brief write delay), the live connection count is used, so the Dashboard never under-reports how many machines are reachable. The count is never allowed to exceed the total number of registered agents.
Lowering Agent:HeartbeatTimeoutSeconds makes the Dashboard flag agents as
offline sooner; raising it tolerates longer gaps between check-ins. See
Configuration.
Agents table#
Below the cards is a paginated table of your agents. Each row shows the machine name, IP address, operating system, an online/offline status pill, and the last heartbeat time:
| Column | Shows |
|---|---|
| Machine Name | The agent's hostname. |
| IP Address | The agent's last-known IP address. |
| Operating System | The reported OS version. |
| Status | An Online or Offline indicator. |
| Last Heartbeat | When the agent last checked in (Never if it never has). |
| Actions | Open the agent's details, or jump straight to running a command against it. |
The list is sorted to surface what matters first: online agents come first, then by most-recent heartbeat, then alphabetically by hostname. Paging is server-side and the page size follows the Default Page Size general setting (default 25). A refresh control on the card header reloads the current page on demand. When no agents are registered yet, the table shows a no agents registered placeholder.
Active deployments#
This panel shows cards for deployments that are currently in flight (up to five at a time). Each card lists the deployment name, the package being deployed, the number of target agents, when it started, and its status, with a progress bar and a "X of Y completed" count so you can watch a rollout advance. A quick action on the card header takes you to the full Deployments page to start a new one. When nothing is deploying, the panel shows a no active deployments message.
Recent commands#
The last panel lists the five most recent remote commands. Each row shows the command text (truncated if long), the target agent (or an "N agent(s)" count when a command fanned out to several machines), its status, and when it was executed. A view action opens the command's output. A shortcut on the card header jumps to Execute Command to run a new one. When there is no command history yet, the panel shows a no recent commands message.
Live updates & auto-refresh#
The Dashboard updates itself in real time. It subscribes to agent heartbeat events over a live server connection, so when an agent comes online or drops off, the status pill on its row and the Online/Offline cards update on the spot — no manual reload needed.
As a safety net, a periodic refresh timer can also reload the agent data on a fixed interval. This is governed by the Dashboard Refresh Interval general setting, in seconds (default 30). Setting it to 0 disables the timer and relies purely on the live heartbeat stream.
| Setting | Controls | Default |
|---|---|---|
Agent:HeartbeatTimeoutSeconds | How recent a heartbeat must be for an agent to count as online. | 60 |
General.DefaultPageSize | Rows per page in the agents table. | 25 |
General.DashboardRefreshInterval | Auto-refresh interval in seconds; 0 disables it. | 30 |
The last two are exposed under General settings in the console; see Configuration for how settings are stored and changed.